January 5, 2010
Professional site selectors, brokers and agents: Get more information! Register with CAN DO for a complete packet of all labor and demographic statistics. (Your privacy is assured. We will never sell or share your personal information.)
Population
| Total Population | |
| Hazleton Area School District | 71,748 |
|
Luzerne County
|
316,383 |
|
Hazleton / Scranton / Wilkes-Barre MSA
|
555,225 |
|
Source: U.S. Census Bureau, 2016 American Community Survey
|
|
| Population by Age and Sex | ||||||
|
Hazleton Area
School District
|
Luzerne County |
Hazleton /
Wilkes-Barre /
Scranton MSA
|
||||
| Total Population | 71,748 | 316,383 |
555,225 |
|||
| Male | 33,555 | 46.8% | 155,463 | 49.1% | 271,176 | 48.8% |
| Female | 38,193 | 53.2% | 160,920 | 50.9% | 284,049 | 51.2% |
| Up to 19 years | 15,390 | 21.5% | 69,839 | 22.1% | 124,832 | 22.5% |
| 20 to 44 years | 22,163 | 30.9% | 95,111 | 30.1% | 166,030 | 29.9% |
| 45 to 64 years | 20,855 | 29.1% | 90,229 | 28.5% | 156,205 | 28.1% |
| 65 years and over | 13,334 | 18.6% | 61,184 | 19.3% | 108,158 | 19.5% |
| Median age (years) | 42.5 | 43.1 | 42.7 | |||
|
Source: U.S. Census Bureau, 2016 American Community Survey
|
||||||
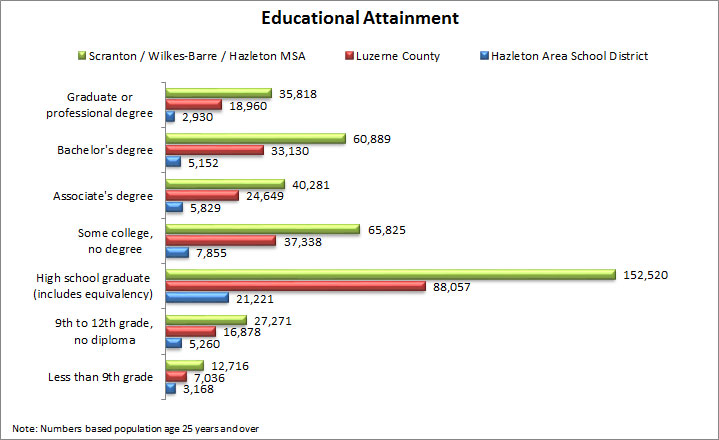
Education
Source: U.S. Census Bureau, 2016 American Community Survey
Income and Benefits
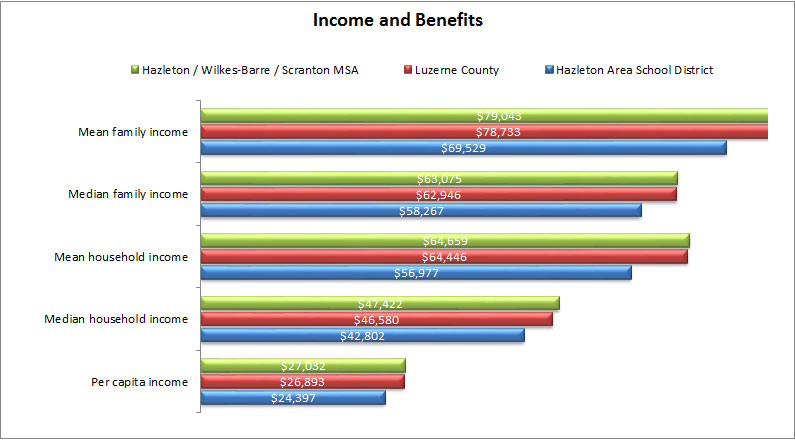
Source: U.S. Census Bureau, 2016 American Community Survey
Employment by Occupation
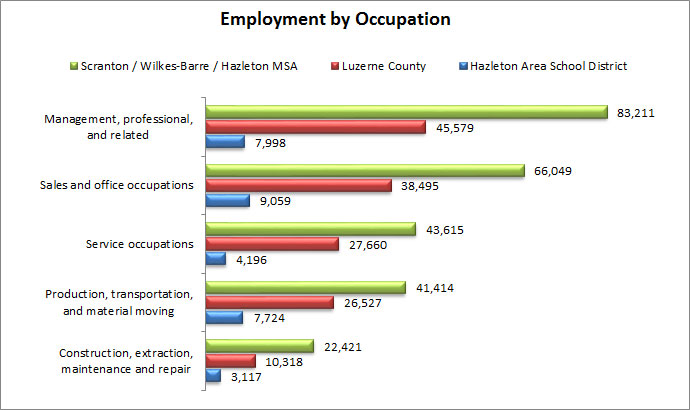
Source: U.S. Census Bureau, 2016 American Community Survey
Labor Market Information
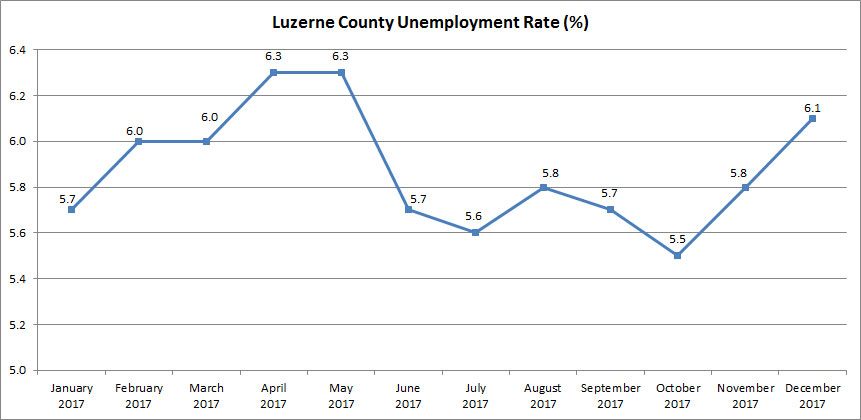
Source: PA Department of Labor & Industry, Center for Workforce Information & Analysis
Greater Hazleton Commute Times
| Commuting to Work | |||
|
Hazleton Area
School District
|
Luzerne County |
Hazleton / Wilkes-Barre
/ Scranton MSA
|
|
| Mean travel time to work (minutes) | 23.2 | 22.5 | 22.3 |
|
Source: U.S. Census Bureau, 2016 American Community Survey
|
|||
Wages
| May 2016 Metropolitan Area Occupational Employment and Wage Estimates Scranton / Wilkes-Barre / Hazleton MSA |
||||
| Occupation | Employment |
Mean Hourly
|
Mean Annual
|
Mean RSE
|
| All Occupations | 256,640 | $19.97 | $41,530 | 1.2% |
| Management Occupations | 7,950 | $49.69 | $103,360 | 1.5% |
| Business and Financial Operations Occupations | 9,030 | $30.67 | $63,800 | 2.7% |
| Computer and Mathematical Science Occupations | 4,310 | $29.53 | $61,430 | 5.2% |
| Architecture and Engineering Occupations | 3,650 | $35.19 | $73,190 | 2.9% |
| Life, Physical, and Social Science Occupations | 1,300 | $30.74 | $63,940 | 6.9% |
| Community and Social Services Occupations | 4,880 | $19.99 | $41,580 | 2.1% |
| Legal Occupations | 1,290 | $31.08 | $64,640 | 7.9% |
| Education, Training, and Library Occupations | 13,880 | $26.31 | $54,730 | 3.6% |
| Arts, Design, Entertainment, Sports, and Media Occupations | 2,140 | $19.56 | $40,680 | 6.2% |
| Healthcare Practitioner and Technical Occupations | 17,400 | $32.75 | $68,120 | 3.3% |
| Healthcare Support Occupations | 9,590 | $14.45 | $30,050 | 1.7% |
| Protective Service Occupations | 5,460 | $21.49 | $44,690 | 7.7% |
| Food Preparation and Serving Related Occupations | 21,860 | $10.71 | $22,270 | 2.1% |
| Building and Grounds Cleaning and Maintenance Occupations | 8,210 | $12.00 | $24,970 | 2.0% |
| Personal Care and Service Occupations | 8,360 | $11.30 | $23,500 | 1.6% |
| Sales and Related Occupations | 23,550 | $16.18 | $33,660 | 2.4% |
| Office and Administrative Support Occupations | 44,230 | $16.47 | $34,260 | 1.2% |
| Construction and Extraction Occupations | 8,800 | $21.49 | $44,690 | 2.3% |
| Installation, Maintenance, and Repair Occupations | 9,930 | $21.00 | $43,690 | 1.5% |
| Production Occupations | 21,550 | $17.11 | $35,590 | 2.6% |
| Transportation and Material Moving Occupations | 29,160 | $16.52 | $34,370 | 1.6% |
|
Source: U.S. Department of Labor – Bureau of Labor Statistics
|
||||